Graphs
The "Graphs" section provides visualizations of key performance metrics for your server. The graphs help you monitor the load and identify potential issues.
Warning
The displayed graphs are not pulled directly from your virtual server. As a result, the values shown may not be entirely accurate.
Graph Categories
The graphs are organized into three categories, accessible via the tabs at the top of the section:
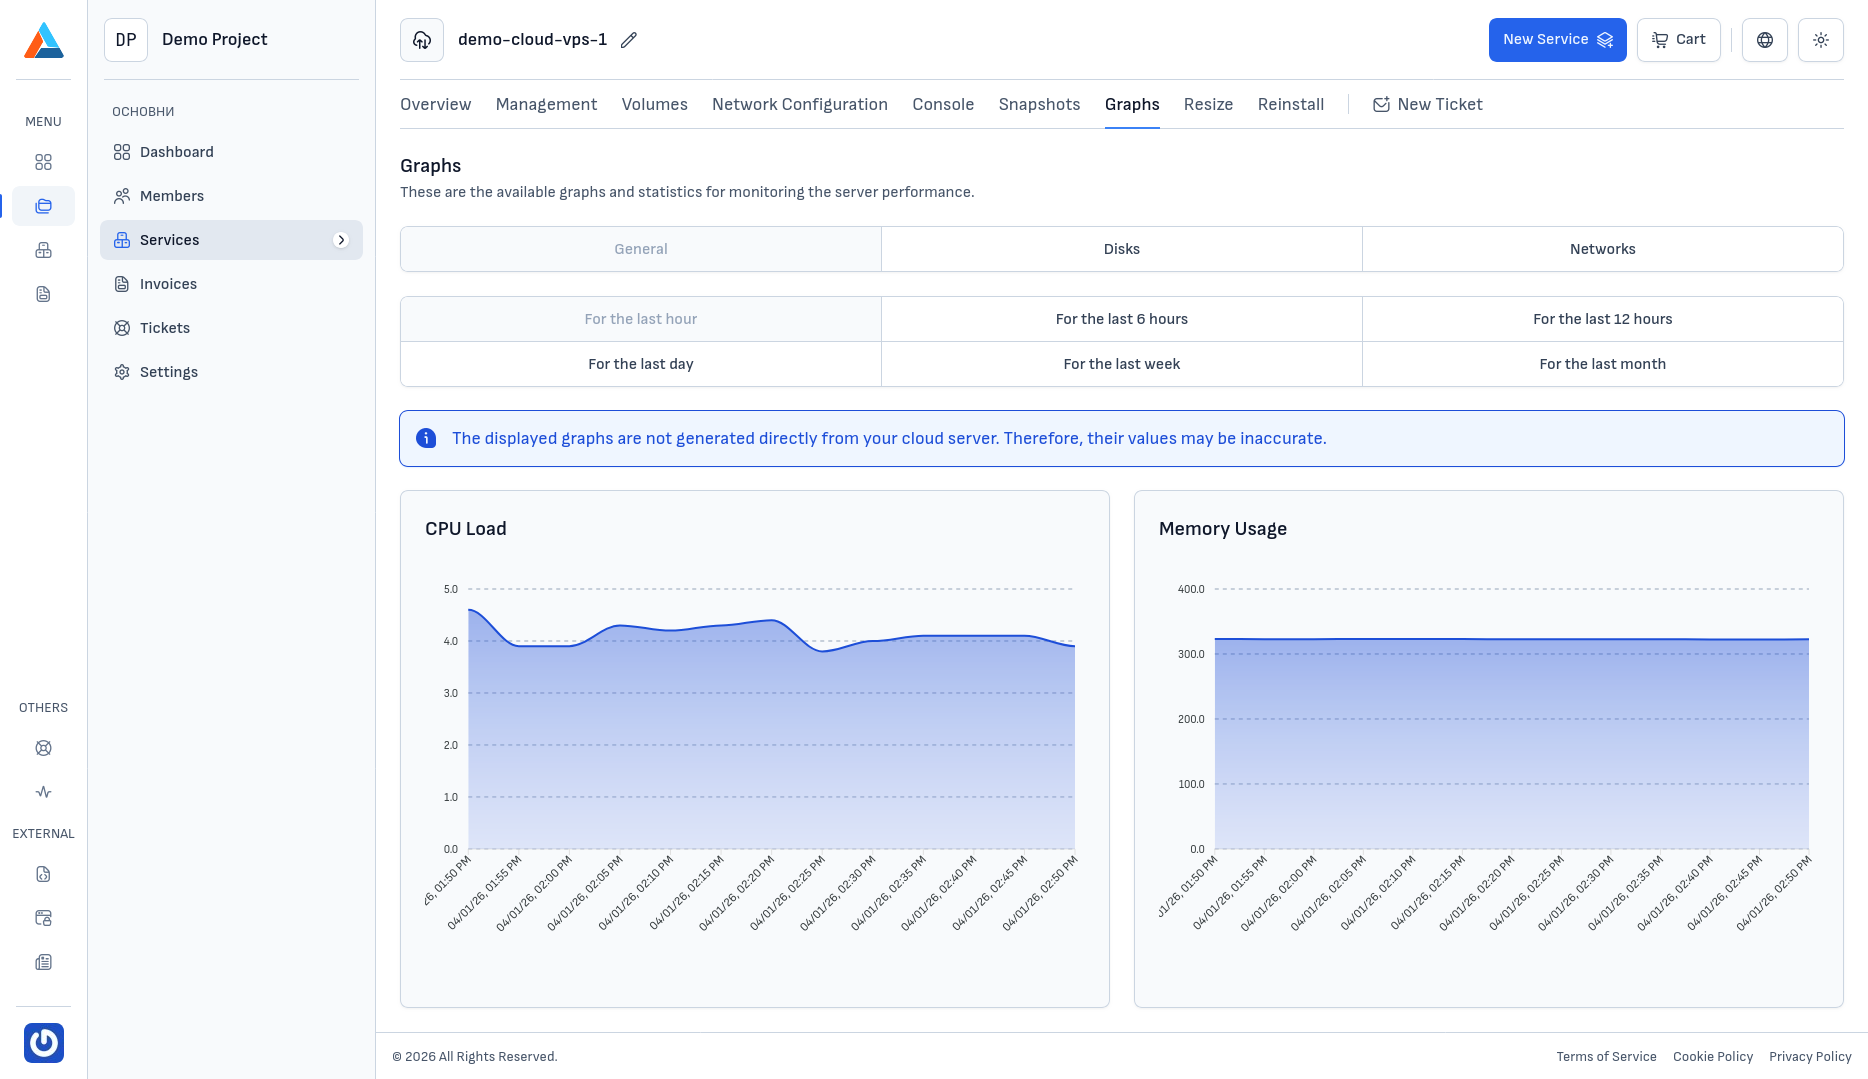
General
In the "General" category, you can monitor:
- CPU usage — the server's CPU utilization (in %)
- RAM usage — the server's memory consumption (in MB)
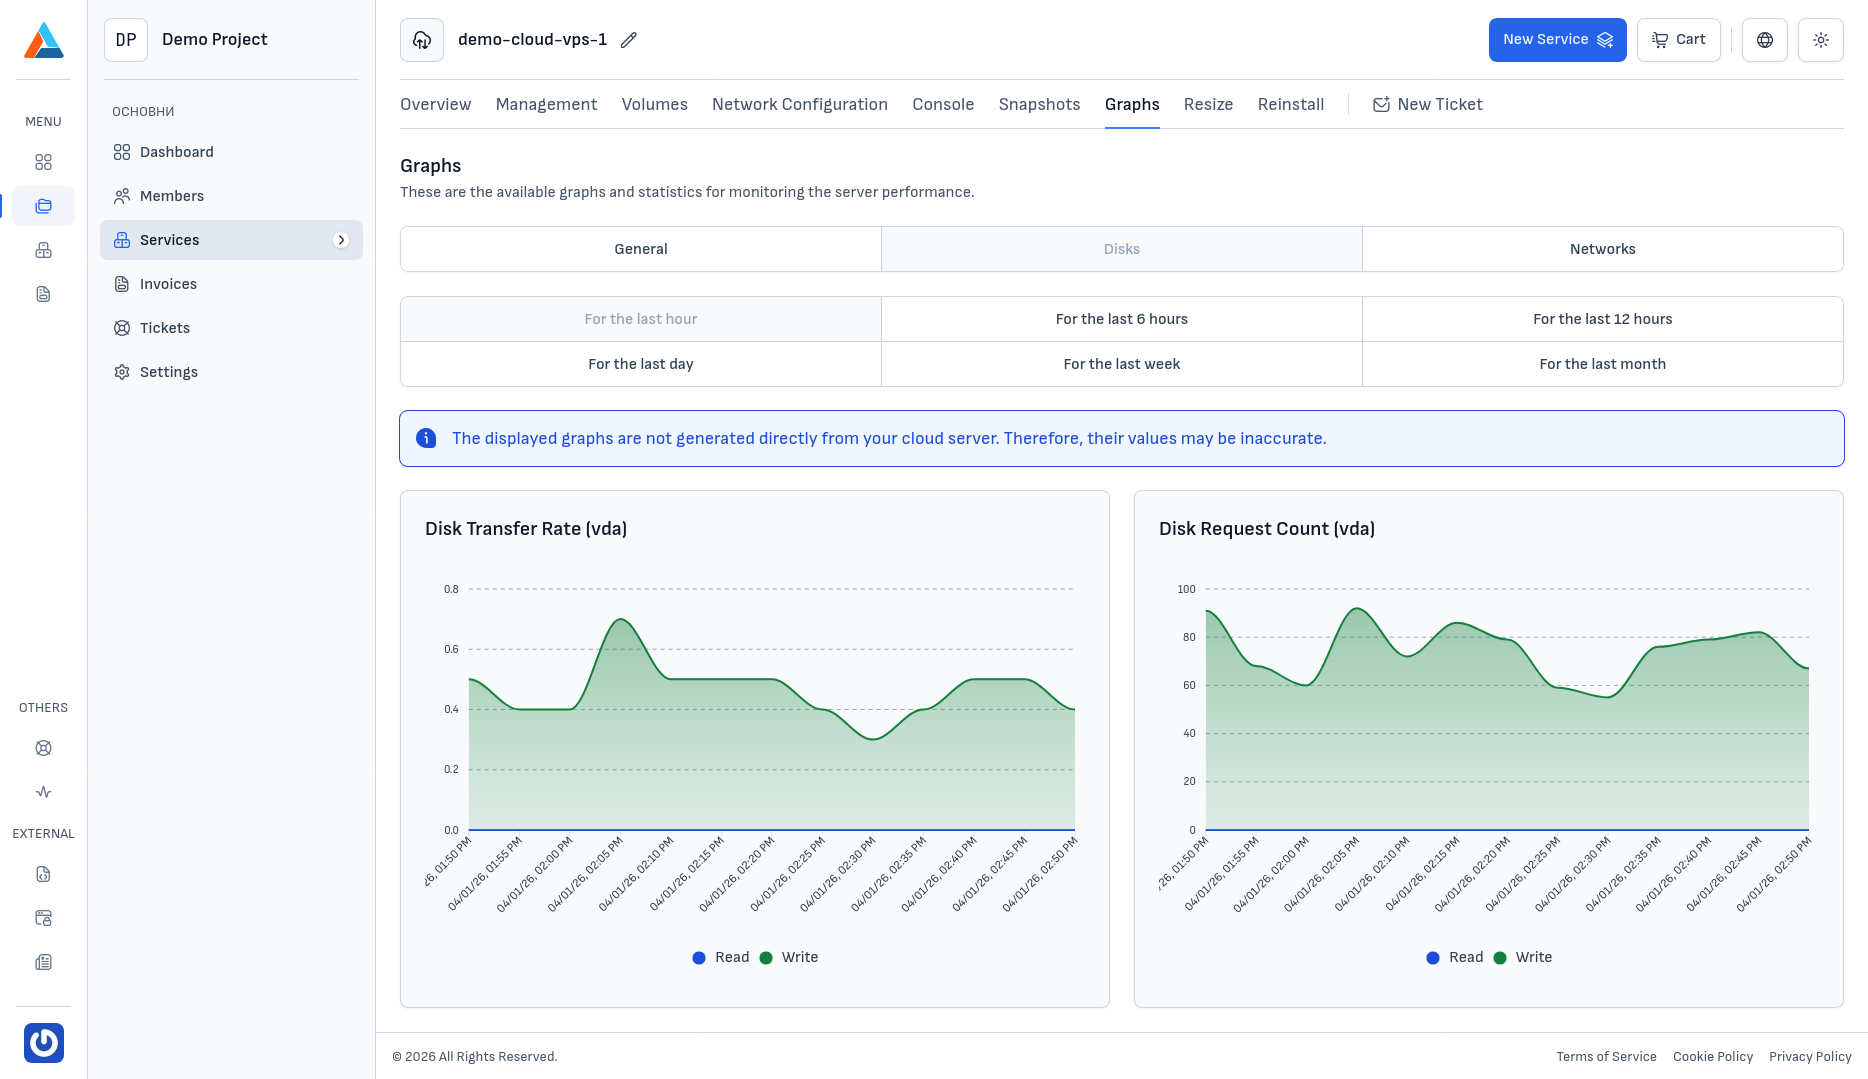
Disks
In the "Disks" category, you can monitor:
- Disk transfer speed — the read and write data transfer speeds to/from the disk (in MB/s)
- Disk requests — the number of read and write I/O operations (IOPS)
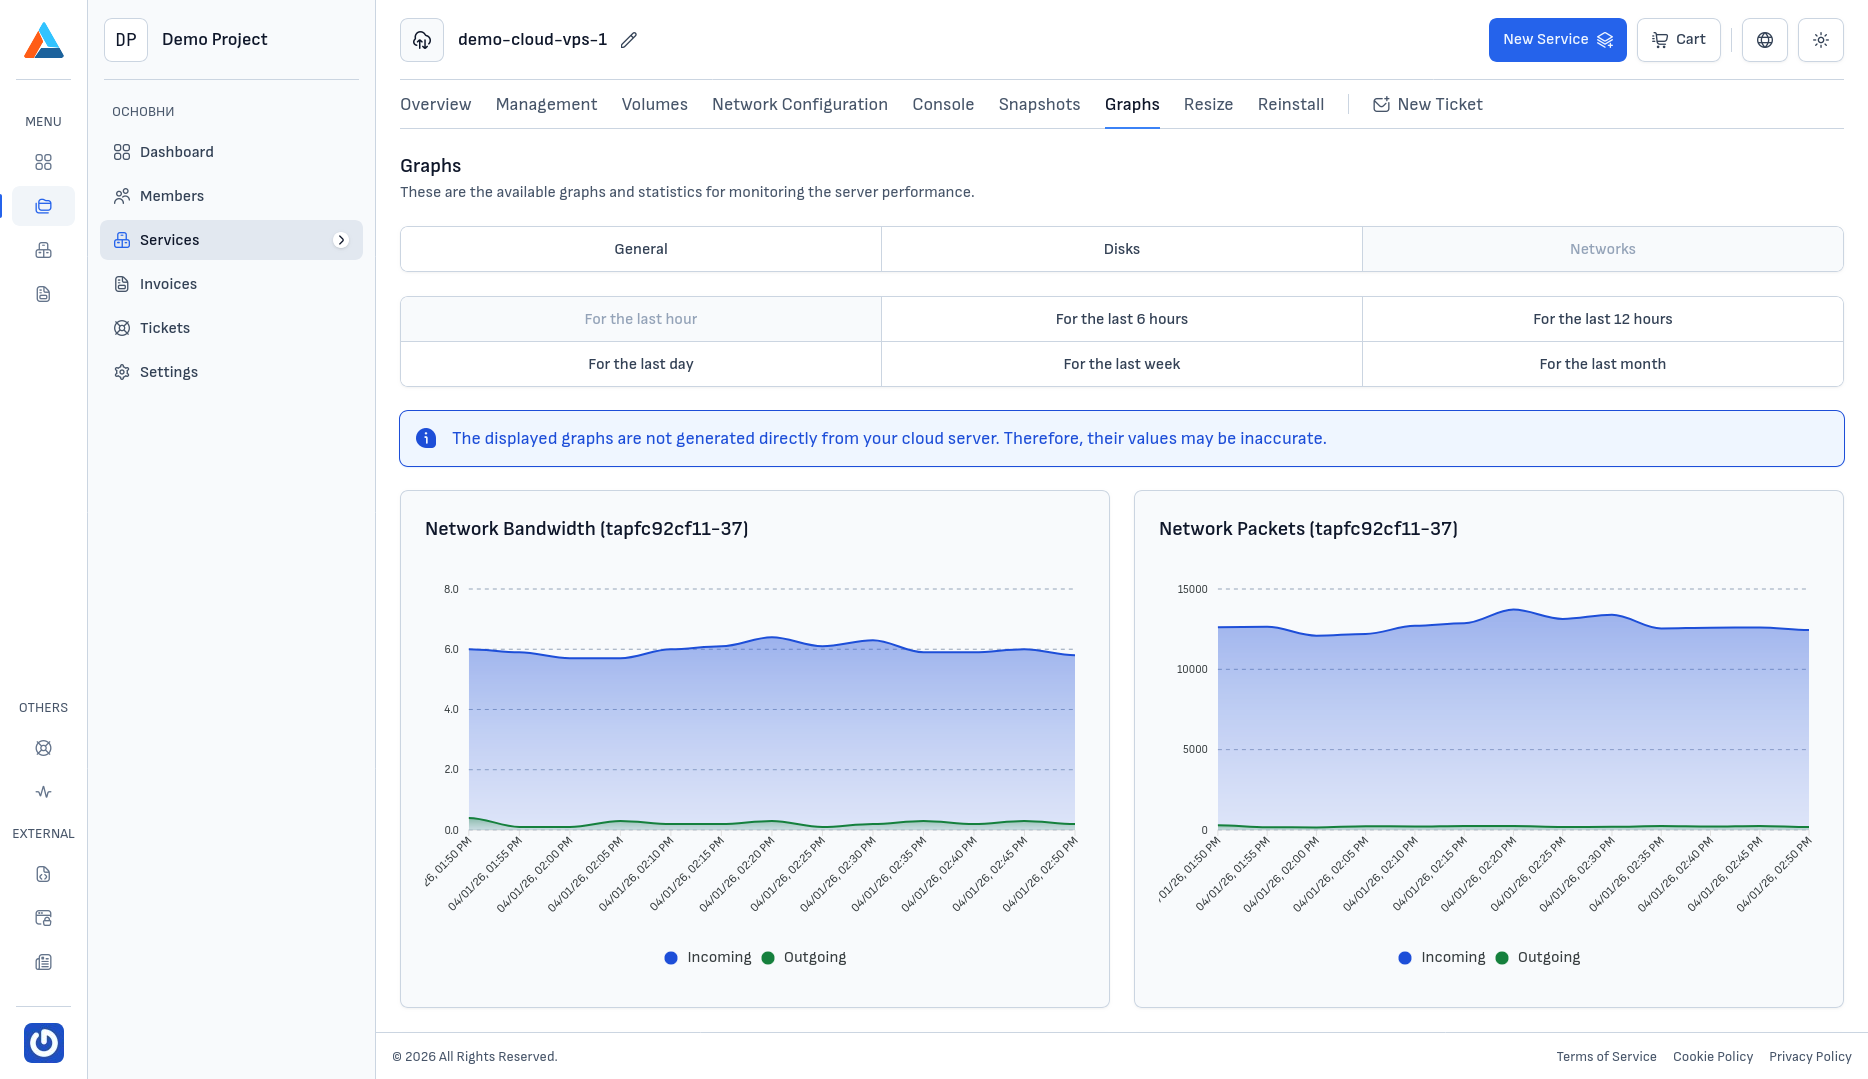
Networks
In the "Networks" category, you can monitor for each network interface:
- Network bandwidth — the inbound and outbound traffic speed
- Network packets — the number of inbound and outbound packets
Observation Period
For each category, you can select a time period for the visualization:
- Last hour
- Last 6 hours
- Last 12 hours
- Last day
- Last week
- Last month