Graphs
The "Graphs" section provides visualizations of request statistics for your GTM server. The graphs help you monitor the load and identify traffic spikes.
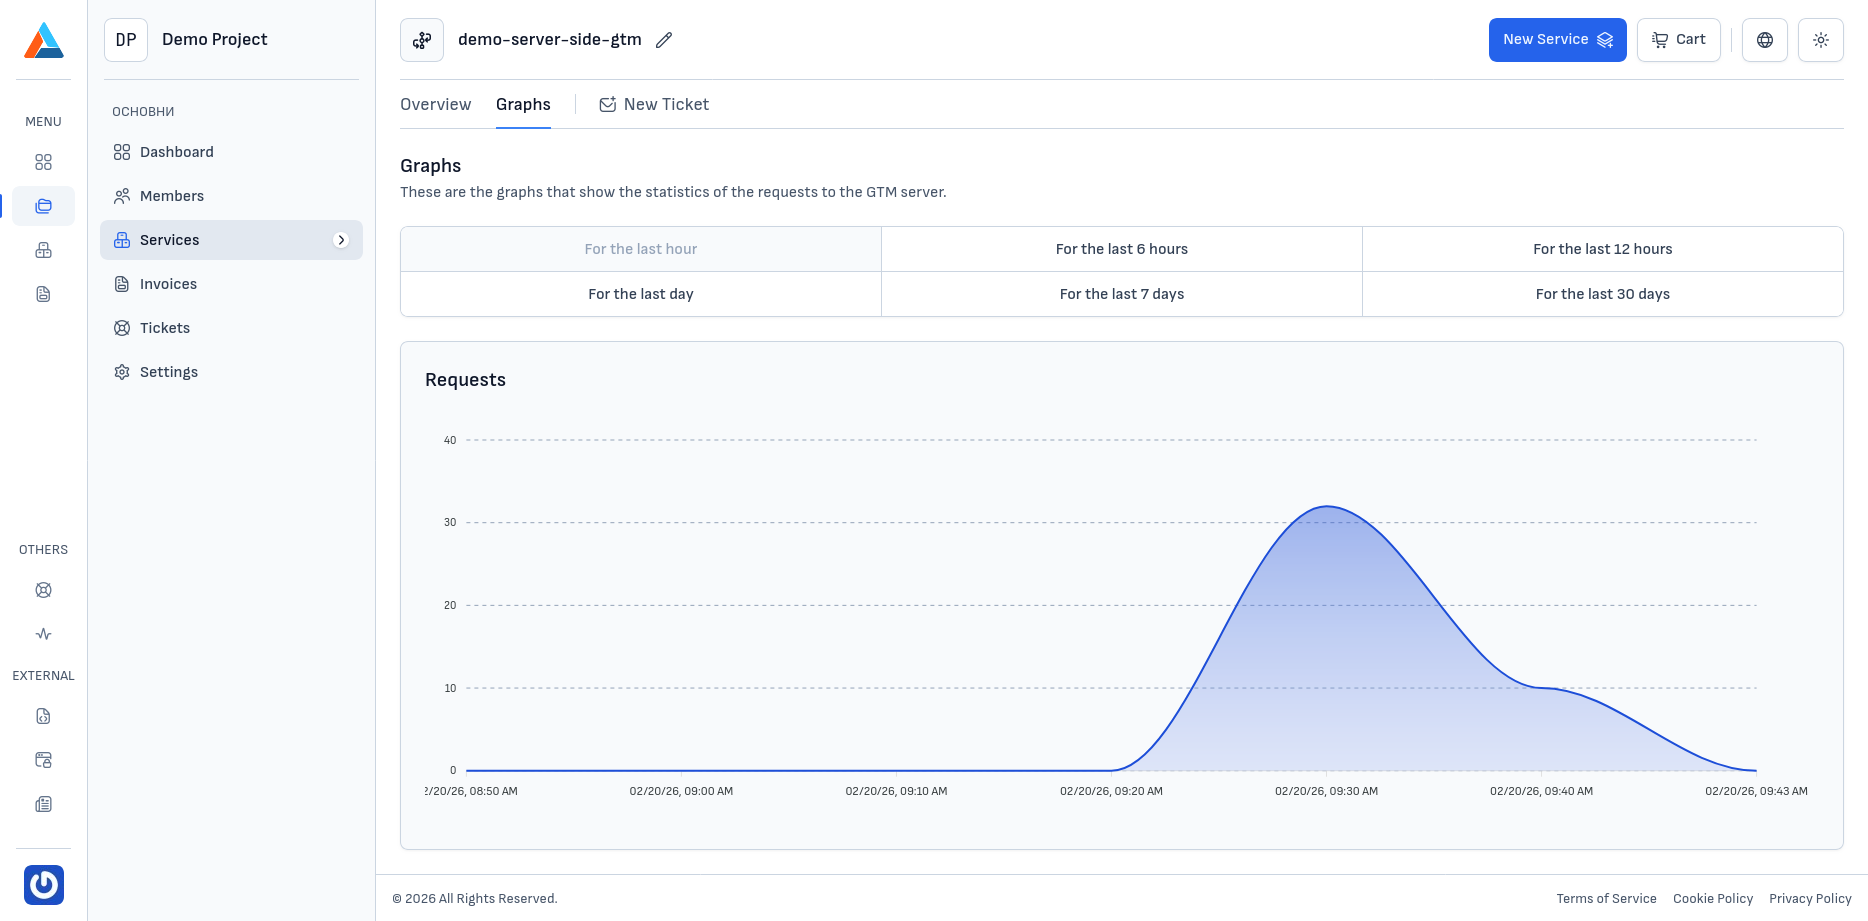
Requests
The "Requests" graph shows the number of requests processed by the GTM server for the selected time period. Through it, you can:
- Monitor the overall traffic volume to the server
- Identify peak loads and trends
- Plan whether upgrading to a higher plan is needed
Observation Period
You can select a time period for the visualization:
- For the last hour
- For the last 6 hours
- For the last 12 hours
- For the last day
- For the last 7 days
- For the last 30 days